
Figure 2 from
Stockman, A., & Sharpe, L. T. (2008). Spectral sensitivity. In T. D. Albright & R. H. Masland (Eds.), The Senses: A Comprehensive Reference, Volume 2: Vision II (pp. 87-100). San Diego: Academic Press Inc.
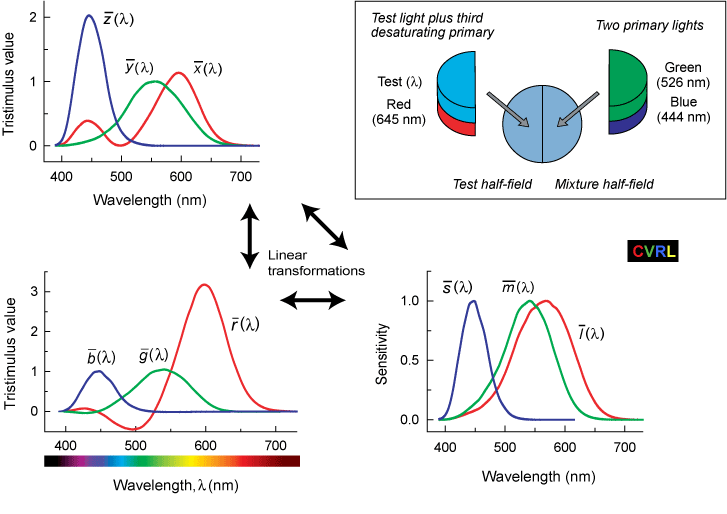
Upper righ insett: Maximum saturation method of color matching using spectral lights. A monochromatic test field of wavelength, λ, is matched to a mixture of red (645 nm), green (526 nm), and blue (444 nm) primary lights, one of which may have to be added to the test field to complete the match. The amounts of each of the three primaries required to match monochromatic lights spanning the visible spectrum are known as the red, green, and blue colour matching function (CMFs; red, green, and blue lines, respectively) shown in the lower left panel. A negative sign means that that primary must be added to the target to complete the match. CMFs can be linearly transformed from one set of primaries to another. Also illustrated here are CMFs for the imaginary X, Y, and Z primaries (top right) and the cone fundamental L, M, and S primaries (bottom left). The CMFs are transformations of the Stiles & Burch (1959) 10-deg CMFs. The fundamentals are the 10-deg cone fundamentals of Stockman & Sharpe. (2000).
Stiles, W. S., & Burch, J. M. (1959). NPL colour-matching investigation: Final report (1958). Optica Acta, 6, 1-26.
Stockman, A., & Sharpe, L. T. (2000). Spectral sensitivities of the middle- and long-wavelength sensitive cones derived from measurements in observers of known genotype. Vision Research, 40, 1711-1737.
Stockman, A., & Sharpe, L. T. (2008). Spectral sensitivity. In T. D. Albright & R. H. Masland (Eds.), The Senses: A Comprehensive Reference, Volume 2: Vision II (pp. 87-100). San Diego: Academic Press Inc.