Figure 1.13 from Sharpe, L. T., Stockman, A., Jägle, H., & Nathans, J. (1999). Opsin genes, cone photopigments, color vision and colorblindness. In K. Gegenfurtner & L. T. Sharpe (Eds.), Color vision: From Genes to Perception (pp. 3-51) Cambridge: Cambridge University Press.
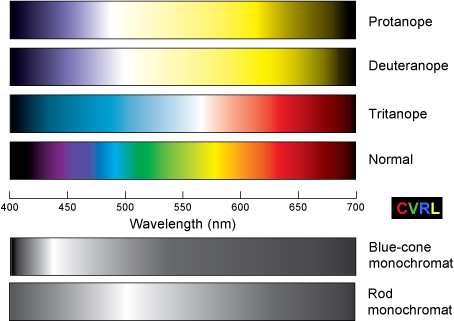
Colour deficiency simulations. The appearance of the visible spectrum for five types of colour blindness: protanopia, deuteranopia, tritanopia, blue-cone monochromacy, and rod monochromacy. Neutral points (or zones) are indicated by the white region in the spectrum for the three types of dichromats. These divide the spectrum into two hues. The shorter wavelength hue is perceived below the neutral point, the longer above. The saturation of both increases with distance from the neutral point. The brightest part of the spectrum roughly corresponds to the lmax of the luminosity function (photopically determined, save for the rod monochromat).
Sharpe, L. T., Stockman, A., Jägle, H., & Nathans, J. (1999). Opsin genes, cone photopigments, color vision and colorblindness. In K. Gegenfurtner & L. T. Sharpe (Eds.), Color vision: From Genes to Perception (pp. 3-51) Cambridge: Cambridge University Press.