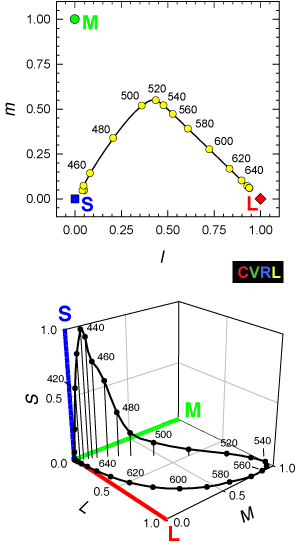

Figure 8 from Stockman, A. (2004). Colorimetry. In T. G. Brown, K. Creath, H. Kogelnik, M. A. Kriss, J. Schmit & M. J. Weber (Eds.), The Optics Encyclopedia: Basic Foundations and Practical Applications (Vol. 1, pp. 207-226). Berlin: Wiley-VCH.
The upper panel shows the spectrum locus (continuous line) andselected wavelengths (yellow circles) plotted in the Stockman & Sharpe (2000) 2-deg l,m cone chromaticity space. The L- (red diamond), M- (green circle), and S- (blue square) cone fundamentals plot at (1,0), (0,1), and (0,0),respectively. The lower panel shows thw spectrum locus (continuous line) and selected wavelengths (filled circles) plotted in the Stockman & Sharpe (2002) 2-deg LMS cone excitation space, and the L- (red line), M- (green line), and S- (blue line) cone vectors.
Stockman, A. (2004). Colorimetry. In T. G. Brown, K. Creath, H. Kogelnik, M. A. Kriss, J. Schmit & M. J. Weber (Eds.), The Optics Encyclopedia: Basic Foundations and Practical Applications (Vol. 1, pp. 207-226). Berlin: Wiley-VCH.
Stockman, A., & Sharpe, L. T. (2000). Spectral sensitivities of the middle- and long-wavelength sensitive cones derived from measurements in observers of known genotype. Vision Research, 40, 1711-1737.